Posts

Showing posts from January, 2022

A Sanitation Goodbye
Image
I'd like to say a huge thank you for keeping up with me throughout my exploration of the theme Water and Sanitation. Grab a coffee and sit down to enjoy the last portion of my blog.  Firstly, i'd like to start of with saying that i've thoroughly enjoyed writing this blog. Although at times I find myself not being able to put the ideas in my head into writing and support this with evidence, I have found that it is part of the process of blog writing and therefore writing these blog posts has been an enriching experience for me. Now I would like to summarise the importance of my blog posts for the theme of Water and Sanitation (and my thought process when writing these posts): First, we saw a worldwide view of the share of deaths from unsafe water sources and found that most deaths resonated in Africa. This led to my exploration of the case of Kampala and the sanitation issues present through understanding pit latrines. I began to wonder reasons as to why Africa was behind on

What does the Sanitation Situation look like across Africa?

Image
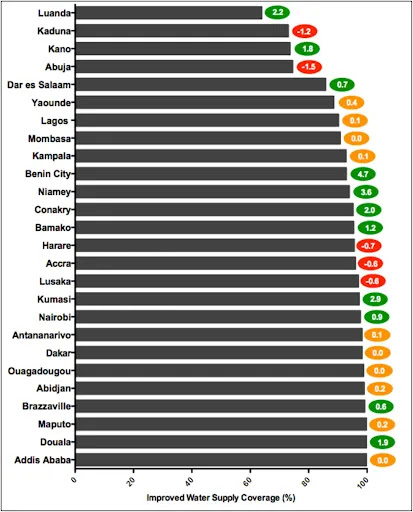
After discussing some solutions to the sanitation problem in my previous blog posts , let's go back to Kampala and analyse whether the sanitation problem has improved or not for the rest of Africa (thank you to Richard Taylor for this blog suggestion!) When there's lots of data, we struggle to pick out what's important and therefore we end up not really understanding the situation at all. This is where the study undergone by Hopewell and Graham comes into play. They outline the sanitation situation in 31 cities in Africa using data from DHS over a 12 year period from 2000 to 2012. The data was compiled into beautifully presented graphs - yay.  I will aim to present three of the four factors affecting trends in access to water supply and sanitation in Sub-Saharan Africa (SSA). I will use this study to compare the sanitation situation to Kampala.  Understanding the graphs : The coloured oval represents the annual rate of change measured in percentage points positive - green