After discussing some solutions to the sanitation problem in my previous blog posts, let's go back to Kampala and analyse whether the sanitation problem has improved or not for the rest of Africa (thank you to Richard Taylor for this blog suggestion!)
When there's lots of data, we struggle to pick out what's important and therefore we end up not really understanding the situation at all. This is where the study undergone by Hopewell and Graham comes into play. They outline the sanitation situation in 31 cities in Africa using data from DHS over a 12 year period from 2000 to 2012. The data was compiled into beautifully presented graphs - yay. I will aim to present three of the four factors affecting trends in access to water supply and sanitation in Sub-Saharan Africa (SSA). I will use this study to compare the sanitation situation to Kampala.
Understanding the graphs:
The coloured oval represents the annual rate of change measured in percentage points
positive - green
negative - red
minimal change - yellow
Analysing improved water supply
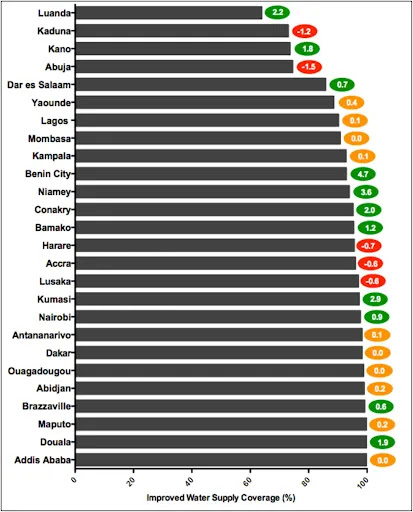
Figure 1: Coverage levels for improved water supply - cities are ranked from most desirable access to poorest access
Benin City had the largest progress with average annual improvement of 4.7% during the 12 year study where as Abuja's coverage had the least progress at -1.5% annually as shown in figure 1.
Most cities have above 80% improved water supply coverage except Luanda, Kaduna, Kano and Abuja.
The progress of Kampala seems to be behind some of the African cities as it remains in the top half of the graph.
Figure 2: Improved Sanitation
Kampala seems to have improved sanitation levels by 0.9% annually during the 12 year study. However, their improved sanitation coverage seems to be quite low to begin with being the 7th lowest out of the 23 cities analysed.
A special mention should be given to the city Douala, in Cameroon with a 9.3% increase annually of improved sanitation coverage.
Most African cities are progressing with improved sanitation coverage (or at least the ones included in the study!) and so it could be safe to say these cities are similar to Kampala at progressing towards a higher level of improved sanitation coverage.
Figure 3 - Prevalence of Open Defecation
The prevalence of open defecation is an excellent indicator of
sanitation access - because if sanitation facilities are unusable, unsafe or simply non-existent then you have no choice but to result in open defecation. Open defecation can lead to
diarrheal disease and currently
215 million people engage in it.
The prevalence of open defecation seems to be on average increasing. Although the coverage of improved sanitation is increasing, we should expect a decrease in open defecation but this isn't the case which is a concern, and efforts in increasing improved sanitation coverage should be re-assessed.
Ok... now to compare the results between the 26 cities.
Only 4 cities (Kano, Harare, Luanda, and Abidjan) made progress in decreasing the prevalence of open defecation. On the other end, Abuja and Benin City have the highest levels (16% and 22.9% respectively) and the most rapidly increasing levels (3.2 and 4.3 annual % points). Kampala seems to lie in the middle for the prevalence of open defecation and could suggest that they are neither ahead nor behind in reducing the prevalence of open defecation when compared to other African cities.
Open defecation could be considered the worst form of sanitation and reducing it should be a priority if sanitation is to improve.
Conclusions
It is concerning that no progress was made at reducing open defecation for half of the cities in the study. You may be wondering why the other indicators such as coverage levels of improved water supply and improved sanitation are improving but the prevalence of open defecation is not. This may be due to most African cities placing emphasis on reaching targets of MDGs and SDGs. However, African cities should not ignore the prevalence of open defecation as it is most relevant to the urban poor in Africa and an indicator of sanitation access.


Comments
Post a Comment